Posts by rollock

    External Content youtu.be
    Content embedded from external sources will not be displayed without your consent.
    Through the activation of external content, you agree that personal data may be transferred to third party platforms. We have provided more information on this in our privacy policy.


    Silver is taxed long term as a 28% tax which is almost double the 15% tax rate for most stocks.

    Selling 1,000 ounces of silver triggers an IRS Alert. Dealer must file a 1099-B with the IRS about the sale.

    Regardless of the quantity of the American silver eagle coin, selling silver eagles to a coin dealer will not trigger a 1099-B.

    Roth IRA taxable silver allows all your gains to be Tax Free.

    External Content youtu.be
    Content embedded from external sources will not be displayed without your consent.
    Through the activation of external content, you agree that personal data may be transferred to third party platforms. We have provided more information on this in our privacy policy.

    There's a crazy demand to secure Silver at the end of 2025. I wanted to do a quick preview of a mining company in the US that secures minerals and that company is Pan American Silver Corp.

    Quote

    Pan American Silver Corp. engages in the exploration, mine development, extraction, processing, refining, and reclamation of mines in Canada, Mexico, Peru, Bolivia, Argentina, Chile, and Brazil.

    The only issue I have in regards to this mining stock is that national export restrictions may lead to hording and complications of this stock. Mexico has already set export restrictions on Silver and other countries such as China impose these restrictions starting Jan 1.

    Let's see where this will ride takes us. Currently trading at $52.69, I'll wait for a dip down to buy in.

    External Content youtu.be
    Content embedded from external sources will not be displayed without your consent.
    Through the activation of external content, you agree that personal data may be transferred to third party platforms. We have provided more information on this in our privacy policy.


    The video "Dubai Physical Silver at $96… COMEX Just Jumped 5% Overnight — Here’s What It Means" from the channel The Exposure Index analyzes a significant "structural break" in the silver market occurring in late 2025 and early 2026. The central thesis is that the traditional "paper" silver market (COMEX) has lost control of price discovery to physical markets, as evidenced by a massive price disconnect between digital charts and real-world transactions.

    The $20 Disconnect and Paper Capitulation

    The video opens by highlighting a 5% overnight "gap" in COMEX silver, moving from roughly $71 to $76. While technical analysts might view this as a routine recovery, the presenter argues it is actually "paper capitulation"—the COMEX finally beginning to acknowledge a physical reality it has denied for weeks.

    While the COMEX struggled at $76, physical silver in Dubai was trading at $96 per ounce. This is not an isolated premium; the video reports physical prices of $93 in Australia, $89 in Canada, and $98 in Russia. This $20 per ounce gap indicates that the "paper" price is currently a fiction, and the overnight jump is simply the paper market "chasing" the physical world.

    The "Manufactured" Crash of December 29th

    A major portion of the video explains why paper silver crashed to $71 in late December despite soaring physical demand. The presenter asserts the crash had nothing to do with market fundamentals and everything to do with institutional balance sheet mechanics and regulatory compliance.

    Financial institutions like banks and hedge funds face a "balance sheet freeze" on December 31st. They must report leverage ratios, Tier 1 capital, and liquidity metrics to regulators. Volatile assets like silver futures require daily margin and consume significant "balance sheet capacity," making them "radioactive" to risk managers as the reporting deadline approaches. To present "clean" and compliant books, institutions were forced to liquidate their silver positions on December 29th, regardless of the metal's long-term value.

    The presenter points to a rare technical anomaly as proof of this stress: the SOFR (Secured Overnight Financing Rate) traded above the Fed's discount window rate. This signal indicates that private balance sheet capacity had completely vanished, forcing institutions to sell their most liquid and "expensive-to-carry" assets—primarily metals—to satisfy compliance rules.

    China’s Export Ban: The January 1st Catalyst

    The recovery and the physical price surge are driven by a looming supply shock: China’s total ban on silver exports starting January 1, 2026. Because China refines roughly 70% of the world's silver, its withdrawal from the global export market creates a "door that's about to slam shut" for international manufacturers.

    Industrial buyers in sectors like solar energy, electric vehicles (EVs), Artificial Intelligence (AI), and medical devices are currently in a state of "outright panic". These buyers are "front-running" the ban, securing months of inventory at any cost to avoid shutting down factories. For these procurement officers, paying $96 in Dubai is "cheap" compared to the catastrophic cost of breaching production contracts or laying off workers due to a lack of raw materials.

    Why Today is Not 1980 or 2011

    The video distinguishes the current market from historical silver crashes. The 1980 Hunt Brothers rally was a speculative paper-driven cornering of a market that actually had adequate physical supply. Similarly, the 2011 rally to $49 was a leveraged bubble driven by retail speculation.

    Today’s situation is described as a "completely different market regime": too much leverage and not enough metal. In 1980 and 2011, the problem was speculation; today, the problem is inelastic industrial demand colliding with a physical shortage. The presenter notes that "you cannot pop physics" or "print silver," meaning traditional tactics like raising margin requirements to flush out speculators will not solve a genuine physical scarcity.

    Five Signals to Watch

    The video provides a framework for monitoring the market's next steps:

    • Global Physical Prices: If prices in Dubai and Russia stay at $96+ or move higher, it confirms the shortage is structural rather than a temporary year-end anomaly.
    • China’s Ban Enforcement: The market will watch for shipping delays and news of manufacturers failing to source Chinese silver after January 1st.
    • COMEX Gapping Higher: If the paper market continues to "grind higher" day after day, it indicates that institutional buyers are returning to rebuild positions and are chasing physical prices.
    • Industrial Delivery Reports: Announcements of long-term supply agreements or massive physical deliveries by companies like Tesla or major solar firms would confirm that the rally is driven by users, not speculators.
    • Gold-to-Silver Ratio: Currently at 56:1, a compression of this ratio would suggest that silver is being recognized as more scarce and urgent than gold.

    Conclusion: Two Paths Forward

    The presenter outlines two possible outcomes. In Path One, the paper market slowly "catches up" to physical reality in an orderly fashion, leading to new all-time highs as $96 becomes the floor. In Path Two, the markets "decouple" entirely. In this "chaos scenario," the paper market becomes a meaningless sideshow, leading to force majeure and cash settlements because the physical metal is simply gone.

    Ultimately, the video advises physical holders to remain patient and ignore paper volatility, characterizing the current gap as validation that physical scarcity is the only reality that matters. For those in paper or cash, the message is one of extreme caution: structural shortages do not offer "comfortable" entries; they offer "violent" ones

    Silver slammed today. $72 ouch but a lot of online sellers are sold out from the rush.

    External Content youtu.be
    Content embedded from external sources will not be displayed without your consent.
    Through the activation of external content, you agree that personal data may be transferred to third party platforms. We have provided more information on this in our privacy policy.

    External Content youtu.be
    Content embedded from external sources will not be displayed without your consent.
    Through the activation of external content, you agree that personal data may be transferred to third party platforms. We have provided more information on this in our privacy policy.

    External Content youtu.be
    Content embedded from external sources will not be displayed without your consent.
    Through the activation of external content, you agree that personal data may be transferred to third party platforms. We have provided more information on this in our privacy policy.

    Asian Guy is back and he's saying shanghai is $85

    External Content youtu.be
    Content embedded from external sources will not be displayed without your consent.
    Through the activation of external content, you agree that personal data may be transferred to third party platforms. We have provided more information on this in our privacy policy.

    The video from the YouTube channel "The Exposure Index" examines a period of "structural stress" in the global silver market, characterized by a record high of $85 per ounce in Shanghai. This price movement is described not as a mere spike or retail-driven momentum, but as a critical signal of a systemic repricing event that forces markets to acknowledge physical reality over financial fictions. While Shanghai reflects a market built on physical settlement, Western benchmarks like the Comex are lagging behind at $79, creating a $6 gap between the price of real metal and paper promises.

    Structural Market Disconnect

    The source argues that for decades, the Comex in New York acted as the global benchmark for silver pricing used by miners, manufacturers, and investors. However, this benchmark is currently breaking because of a fundamental structural difference: the Shanghai Futures Exchange and the Shanghai Gold Exchange are biased toward physical delivery. In Shanghai, industrial users, refiners, and state-linked entities buy contracts with the expectation that physical bars will actually arrive at their facilities for use in manufacturing.

    In contrast, the Comex operates on a highly leveraged structure where financial settlement is the norm and physical delivery is the exception. Estimates suggest that less than 3% of Comex contracts result in delivery, while the total "open interest" (paper claims) represents multiples of the global annual mine supply. This system functions only as long as physical demand remains quiet. Currently, the $6 premium in Shanghai indicates that industrial buyers are paying more because they cannot secure physical metal at the Western paper price. Consequently, Shanghai is becoming the new reference point for anyone who needs actual metal, while the Comex price is viewed as a "theoretical" screen price.

    Historical and Monetary Distortions

    To understand the gravity of the current situation, the video places the silver price in the context of 2,000 years of monetary history. For centuries, including during the Roman Empire and the bimetallic standards of the 18th and 19th centuries, the gold-to-silver ratio averaged between 10:1 and 15:1, reflecting the relative natural scarcity of the two metals. Today, the ratio is approximately 50:1, which represents an extreme distortion from historical norms.

    Historically, such distortions resolve through violent repricing events where silver surges to re-establish its historical relationship with gold. For example, the ratio compressed violently during the silver rallies of 1980 and 2011, both of which saw silver outperform gold by multiples in a matter of months. The current ratio is even more extreme than it was prior to those previous major explosions, suggesting a "mean reversion" is highly likely.

    The Consumption Paradox and Supply Inelasticity

    A critical difference between gold and silver is their above-ground availability. While most gold ever mined (approximately 6.4 billion ounces) remains intact in vaults or jewelry and can be sold back into the market during price rallies, silver is a consumed commodity. Silver is used in tiny, often unrecoverable amounts in electronics, medical devices, and industrial chemistry. This means that when silver prices rise, there is no massive buffer of old metal to flood the market.

    Furthermore, silver supply is structurally inelastic. Approximately 70% of global silver production is a byproduct of mining copper, lead, and zinc. Therefore, even if silver prices double, it does not automatically trigger more production because the primary economic driver remains the price of the base metals. For the remaining 30% of primary silver mines, the timeline from discovery to production can be 10 to 15 years due to permitting and financing challenges. Because supply cannot respond quickly and recycling is limited by the dispersed nature of silver use, price is the only variable left to balance the market.

    Exploding Industrial Demand

    The pressure on the silver market is intensified by "price inelastic" industrial demand. The solar industry alone consumes roughly 200 million ounces annually, and newer, more efficient solar cells (like Topcon) require 50% to 80% more silver per panel. In the automotive sector, next-generation electric vehicles utilizing solid-state batteries (the "Samsung protocol") could require between 500 grams and 1 kilogram of silver per vehicle to prevent battery failure and enable ultra-fast charging.

    If EV production reaches 30 million units annually, this sector alone would require nearly half of the global mine supply. For high-tech manufacturers, silver is non-substitutable; they must pay the market price or shut down production, which is why they are currently paying the $85 premium in Shanghai to secure survival.

    The Failure of Arbitrage

    Standard economic theory suggests that arbitrage should close the $6 price gap between New York and Shanghai, but this mechanism is failing because the physical metal is scarce. To perform the arbitrage, a trader must buy a Comex contract and demand physical delivery. However, the Comex currently has a leverage ratio of 13:1—for every ounce of silver in the vault, there are 13 paper claims against it. As traders attempt to move metal East, they discover that Western inventories are too thin to satisfy the demand.

    This failure of arbitrage exposes the fragility of the paper market. The source predicts that as the price gap approaches $8 to $10, a "feedback loop" of panic and forced liquidations will begin. Eventually, the Comex will be forced to "gap up" violently to catch up with physical reality, ending the era where paper contracts could suppress the value of a finite physical resource. For those holding physical metal, this is framed as a paradigm shift where power moves from the futures exchanges back to the owners of the actual asset.


    External Content youtu.be
    Content embedded from external sources will not be displayed without your consent.
    Through the activation of external content, you agree that personal data may be transferred to third party platforms. We have provided more information on this in our privacy policy.

    External Content youtu.be
    Content embedded from external sources will not be displayed without your consent.
    Through the activation of external content, you agree that personal data may be transferred to third party platforms. We have provided more information on this in our privacy policy.

    Local Overview

    I did a review of sectors that appear to be down mid-November with my State of the Stock Market - November post to generate some ideas for future investments. NCLH appeared on my radar at that point. Open instagram, and you'll see friends and family going on cruises towards Belize and the Caribbean. Looks like there are several companies that operate these cruises including CCL, RCL, and NCLH.

    Financials

    According to Yahoo...

    Quote

    Quote

    Norwegian Cruise Line Holdings Ltd., together with its subsidiaries, operates as a cruise company in North America, Europe, the Asia-Pacific, and internationally. It operates the Norwegian Cruise Line, Oceania Cruises, and Regent Seven Seas Cruises brands.

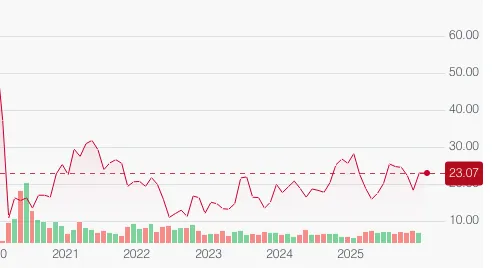
    The stock itself is volatile with a beta of 2.12. The P/E Ratio is decent at 16.63 and EPS is 1.39 @TOP. Historically though, going back to pre-covid times. The stock peaked at 60 dollars but appears to have had trouble recovering the past several years. The only positive to note is that this appears to be a seasonal business. This stability would allow for predictable entry points for any investor.


    Entry Point

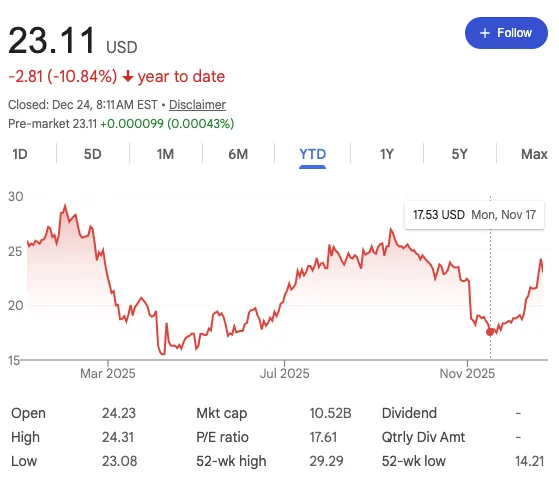
    For the year, NCLH is -10.84% if you can get in at the lowest point, then the upside could be approx. 80-90%

    The closes lowest point being $17.69 on November 17th.

    Closing Notes

    At the low cost of $23 bucks, Norwegian Cruise Line Holdings appears to be an affordable option for a value investor looking to enter the market. If one can time the dip and the peak, there is money to be made!